FIRST TERM
Units
1. The physical map of the Earth
2. The political organisation of societies
3. Economic activity and work
4. Economic and social inequalities
UNIT 1: The physical map of the Earth
Google Earth Tour: Continents and Oceans
Documentary Inside the Planet Earth
LESSON PLAN
HOW TO MAKE A CLIMOGRAPH
|


Example:

 |
| Recordad las fotocopias no se pueden perder, NOS CUESTAN DINERO A TODOS! Por otra parte, para aquellos que no han podido asistir a clase aquí tenéis la tabla, escoged una ciudad. |
UNIT 2: The political organisation of societies
 |
| The political map of Europe. Please write down the names of the states and their captitals beside the points given. You must colour just those countries that belong to the Eropean Union Deadline: Monday, 29th October 2012 |
 |
Lesson Plan. Stick it in your notebook at the very beginning of the unit.
|
 |
| Worksheet 1. The organization of a state. Examples |
 |
| Worksheet 2.`Political systems around the world |
 |
| Worksheet 3. The organisation of the UN |
 |
| Worksheet 4. The European institutions |
UNIT 3: Economic Activity and Work

 |
| LESSON PLAN. Stick it in your notebook |
 |
| WORKSHEETS |
UNIT 4: The Economic and Social Inequalities.
 |
| PHYSICAL MAP OF SOUTHAMERICA. Deadline: Monday, 10 december 2012 |
 |
| LESSON PLAN. Stick it at the very beginning of the unit. |
 |
| MAP GIVEN FOR ASSIGNMENT 2. |


SUMMARY
1. INDICATORS AND CAUSES OF INEQUALITIES
The different indicators used to measure socio-economic inequalities between countries are: the HDI, the GDP and the daily consumption of calories.
The HDI (Human Development Index), created by the United Nations, takes into account these criteria: the GDP per inhabitant, life expectancy, literacy rate and attendance in primary, secondary and further education. The result is expressed as a number between 0 and 1, which defines the level of development in the country.
The GDP (Gross Domestic Product) measures the total production of a country and is used by the World Bank. UNICEF uses the daily consumption of calories as an indicator to see whether the basic dietary needs of the population are being covered.
Causes of inequality
INTERNAL CAUSES
|
EXTERNAL CAUSES
|
Natural conditions: climate.
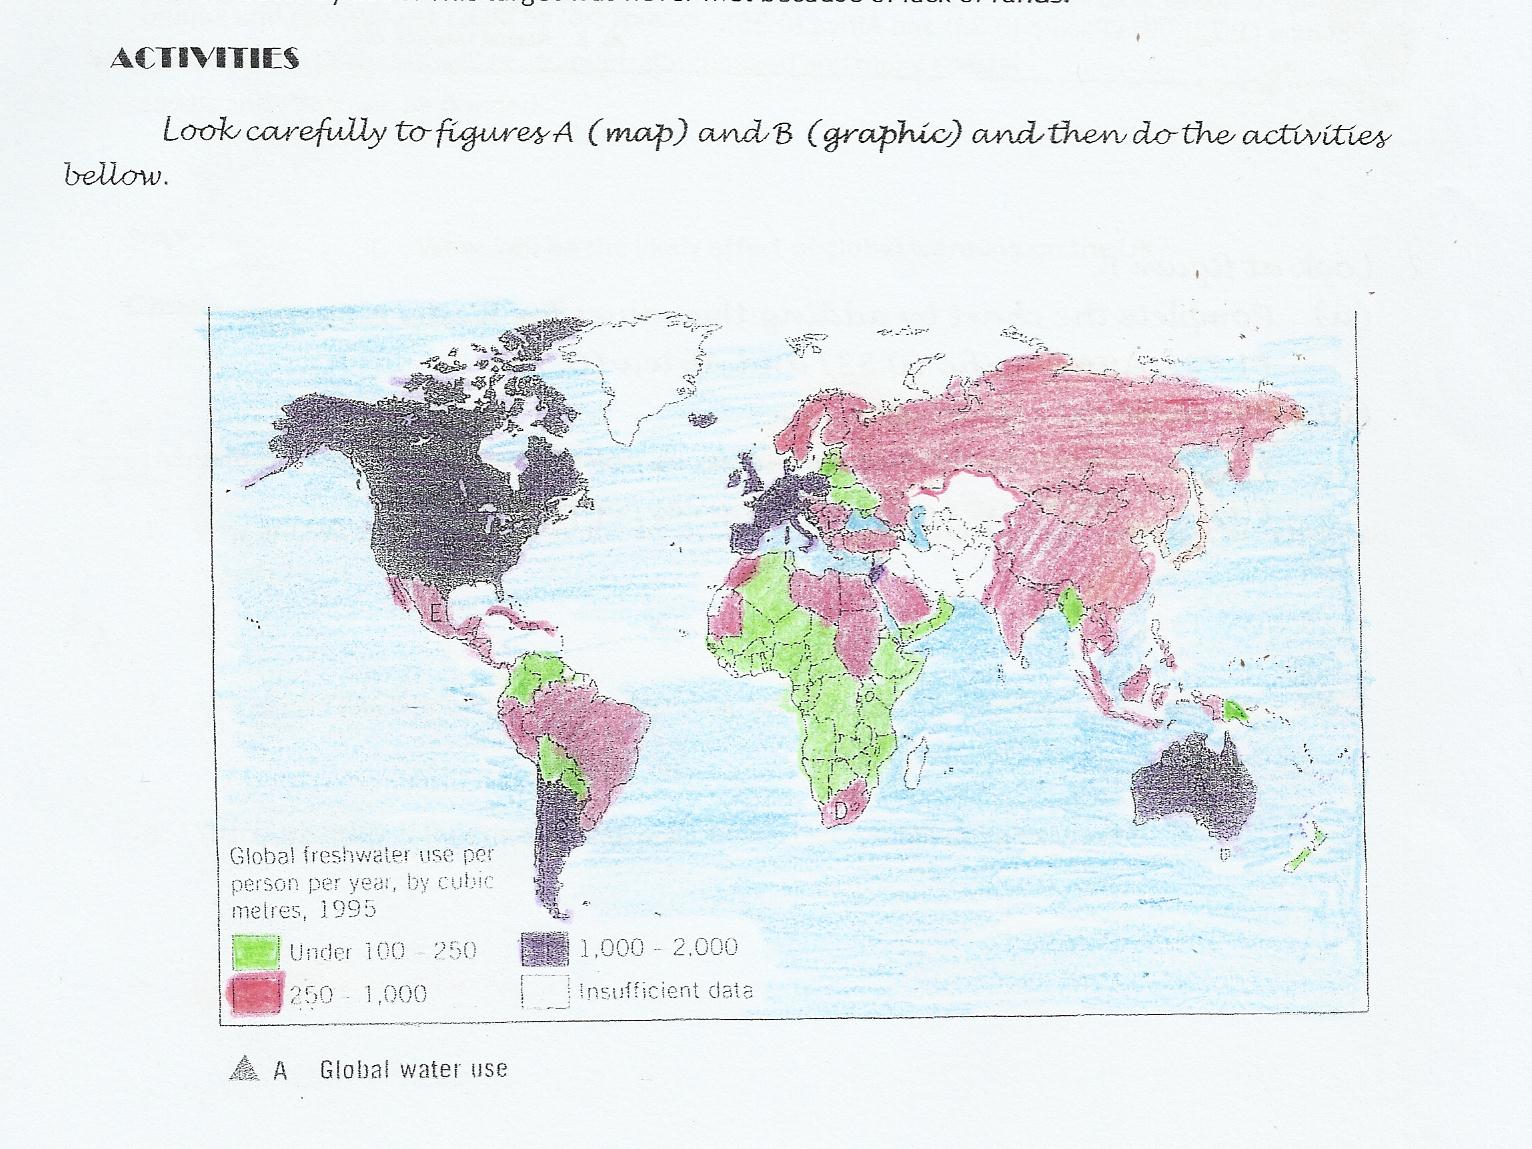
Availability of resources and the relationship between those resources and the population (e.g. freshwater)
Tropical zone: underdeveloped and developing countries
Temperate zone: developed countries.
Exceptions: Japan (very few resources but huge exports of technology)
Emerging countries: Brazil and Venezuela (natural resources)
|
Decolonization process
Unbalanced trade
Developed countries import cheap raw materials while they export expensive manufacture goods to their old colonies (most of them located in Africa).
· These inequalities became worse during the Industrial Revolution.
· These imbalances still exist today and since the 1990s have became greater.
|
2. THE INFLUENCE OF GLOBALISATION
Globalization means that production, consumption and exchange of goods are organized on a worldwide scale, which has been made possible by advances in telecommunications and transport.
Central and peripheral areas
The central areas are dominant at world level. They are composed of the world Triad (USA, EU and Japan). These are joined by the emerging countries such as China, India and Brazil, and regional powers such as Russia, Australia and South Africa.
The peripheral areas are dependent on the dominant areas. They are the developing countries of Sub-Saharan Africa* and numerous Asian and Latin American countries
*Sub-Saharan Africa is, geographically, the area of the continent of Africa that lies south of the Sahara. Politically, it consists of all African countries that are fully or partially located south of the Sahara (excluding Sudan).[2] It contrasts with North Africa, which is considered a part of the Arab world. Somalia, Djibouti, Comoros and Mauritania are geographically part of Sub-Saharan Africa, but also part of the Arab world
Relationship between these areas:
The central areas export high-value products and technology, make investments and grant loans for development, offer advanced services and provide skilled workers, while peripheral areas export raw materials and cheap manufactured goods, so they have high levels of external debt and as a result they lose capital as they have higher levels of external debt. They usually offer tourism to rich tourists from developed countries.
3. DEVELOPMENT AND UNDERDEVELOPMENT
A. Developed countries
They are located in the northern hemisphere; they are a small number of countries and the majority of them in temperate zones. Their economic wealth can be seen in the high GDP per inhabitant and high standard of living, the population has its basic needs covered, has high levels of consumption and the State provides the fundamental social services, such as health care and education. As a result of this, inequalities have been reduced and most of their political systems are based on democracy.
B. Developing countries
They are located in the southern hemisphere: Sub-Saharan Africa, Latin America and South Asia. Most of them belong to the warm zone. Their economic poverty can be seen in the low GDP per inhabitant and in a low standard living, because the basic needs of the majority population are not of the covered it suffered from malnutrition, lack of health care services, illiteracy, child labour. The State invests almost nothing in social services.
C. Emerging countries
The emerging countries, such as China, India, Brazil or Mexico, combine features of development and under-development. Their economies have experienced rapid growth, but the GDP per inhabitant remains relatively small because their economy is based on low labour costs and the majority of the workers have low salaries.
The political systems are recent democracies or they continue to show a lack of rights and freedoms.
4. HOW TO RESOLVE INEQUALITIES
There is an official development assistance given by developed countries. In 1970, the UN agreed that developed countries world dedicate 0.7% of GDP to development of poor countries.
But there is also non-official development assistance that comes from donations of ordinary citizens. This aid is managed by non-governmental organizations for development (NGODs), composed of volunteers.
The Millennium Summit (look it up on the vocabulary) in 2000 was a very important conference, where the participating countries committed themselves to collaborating to achieve the so-called millennium development goals by 2015.
There are also imbalances in the level of development within the European Union. These imbalances have become more obvious since 2004, due to the entry of new members.
The funds to finance these objectives are the ERDF (European Regional Development Fund), dedicated to reducing imbalances in the EU; the ESF (European Social Fund) aimed at developing human resources and employment, and the Cohesion Fund, for investment in trans-European networks and the environment.
UNIT 5 (10): Environmental problems
 |
| LESSON PLAN UNIT 5 (10). Stick it at the very beginning of the unit. |

 |
| Deadline: Monday 14th january, 2013 |
 |
| WORKSHEET 1 |

 |
WORKSHEET 2
 |
| WORKSHEET 3 |
UNIT 6 (3): The Global Population
 |
| Lesson plan Unit 6. Stick it before starting the activities. |
First listen and then answer the questions:
1. By 1850 the population has doubled to .................
We are now well passed..........................billion
2. What is the Millenium problem this man is talking about?
3. What were the factors of the rapid growth of the population?
4. What do we really need for growing products or making items?
5. What the animals and human beings are fighting for nowadays?
6. Why are families smaller nowadays? Give as many reasons as you understand.
 |
| THE PHYSICAL MAP OF ASIA. Deadline: 4th february 2013 |

 |
| WORKSHEET 1. Live in a village of Sudan. |
Activity
Useful information:
Follow the instructions
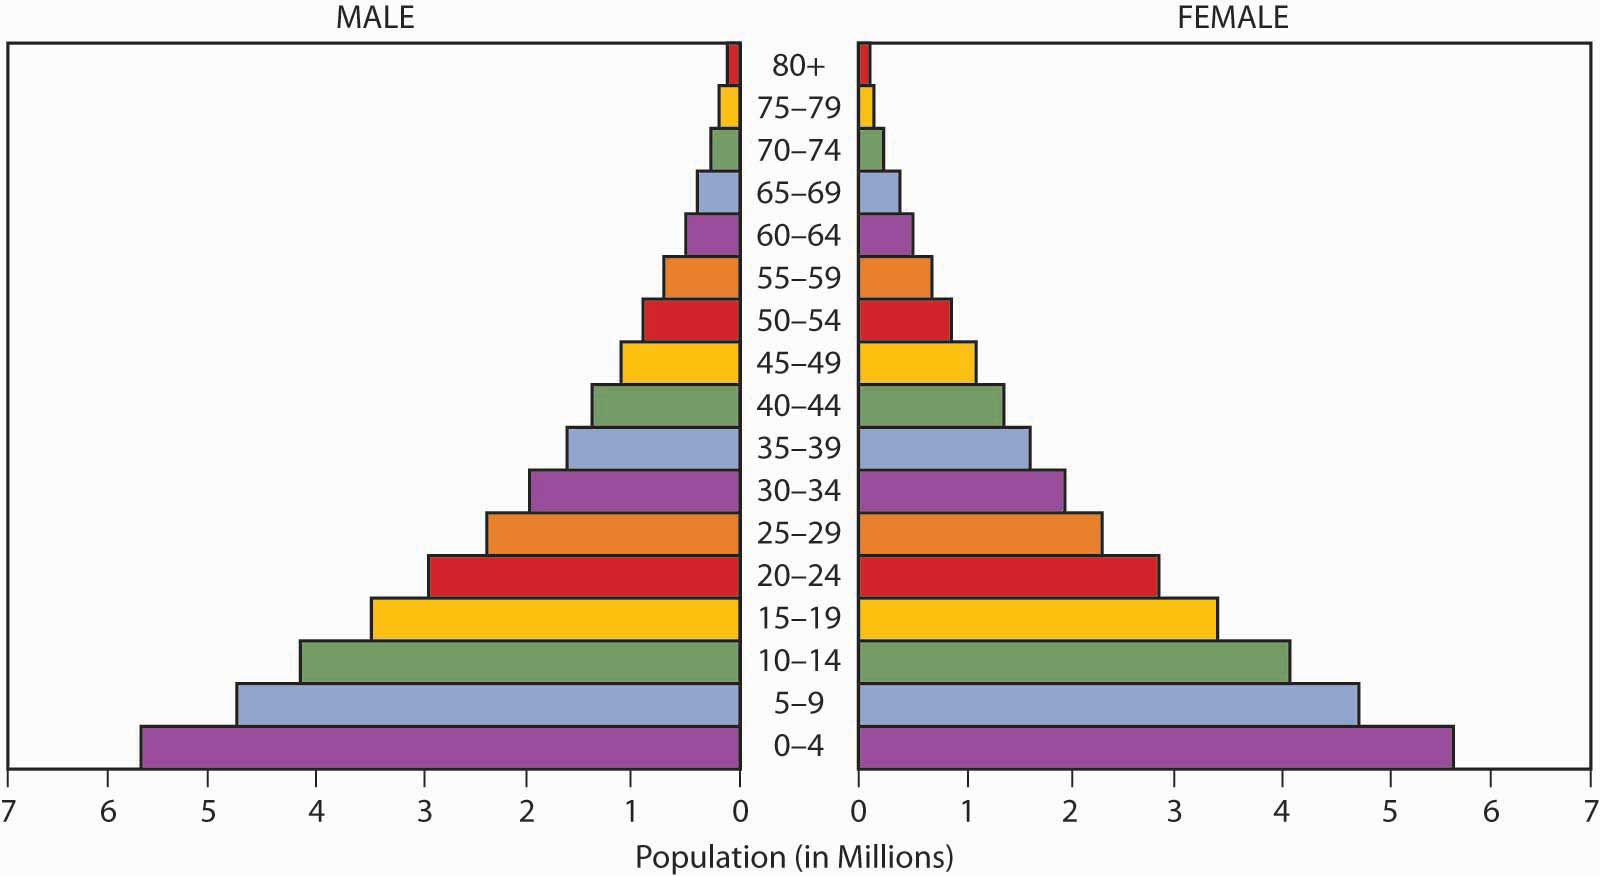
•Find a population pyramid typical of a poor country copy and paste it into your document then add labels to explain what is shown.
•Repeat it for an rich country.
•Write about what the graphs show and try to give reasons for the patterns.
THE POWER POINT IS HERE. Have a look at it
POPULATION PYRAMIDS
And this is the webside you must use in order to find a proper population pyramid:
www.census.gov
And this is the webside you must use in order to find a proper population pyramid:
www.census.gov
When you have finished;
Find out some background information on each country and add this to your presentation.
Concentrate on facts and figures which you can use to compare the countries such as % of the children at school, type of jobs available, how rich or poor (GDP per capita.)………
Find a city from that country, add pictures and talk about it.
Useful information for the exam taking into account the length of this unit. But do not get used to it, please!
-Distribution of the global population: regions with high population densities and those with low population densities.
-Identify the distribution factors: I mean physical factors and main human factors
-Natural population movements: Vocabulary like natural increase, migratory movements, birth rate, death rate, life expectancy, ageing population. Also you must learn the formulas and apply them for calculating percentages by the table given.
- In the same chapter also the factors related to birth and death rates, it is important to use them for giving me reasons at the time you comment the pyramids (population pyramid also in the definitions).
- Study the graphic about the demographic transition; label it with the dates and the same questions in activity 2.
The first stage showed very high birth and death rates; in the second stage (called demographic transition), the death rate fell considerably while the birth rate remained high, and the current third stage shows a deceleration of both the birth and death rates.
In the first stage, high birth and death rates coincided in time with catastrophes: famines, plagues, wars. The second stage was characterized by the agricultural revolution, which improved the population’s general level of nutrition and advances were made in hygiene and medicine.
In the third stage, the population has decreased and aged, and birth rates have fallen to sub-replacement levels.
-I will paste the three pyramids you have at the end of the unit to identify them according to their development. And give me the reasons why.
- Finally the consequences of the migration (7.3).
UNIT 7 (4): Modern Day Cities

WORKSHEET 1
– Look at the three photos and do these activities:
• Write which part of the urban structure each photograph corresponds to:
historic centre, area of expansion or periphery.

Part of the urban structure:
................................................................................................................................
Characteristics: ..................................................................................................................................................
............................................................................................................................................................................
............................................................................................................................................................................
UNIT 6 (8): Primary Sector Activities
LESSON PLAN
Map: THE POLITICAL MAP OF ASIA
(Deadline: 3rdApril)
Exercises: Page 108 exercises:
Before
you start (1 and 2)
Page 110; exercises
1, 2, and 3
Page 112; exercises
1 and 2
Page 117;
exercises 1, 2, and 3
Page 119, exercises 1 and 3
Page
120; exercises 1, 2 and 4
Page
123; exercises 1 and 3.
Page
124; exercises 1, 2 and 4.
Page
126; exercises 1 and 2.
Page
129: Organize
what you know
Worksheets: Which agricultural landscape the illustration is
describing?
Find landscapes and leading fishing
countries.
Voluntary
Work: Page 131; exercise 4

 |
| WORKSHEET 1. Which agricultural landscape the illustration is describing? |
 | ||||||
| WORKSHEET 2. Find landscapes and leading fishing countries.
UNIT 7 (9): THE WORLD OF INDUSTRY
VIDEO PRACTISE (3ºD)
Listen carefully and answer the questions:
Questions:
1. When
they say the nuclear reactor accident is stable, what does this actually mean?
2. Name two
consequences resulting from the nuclear accident in Fukushima, Japan that have
affected the people.
3. As the
years go by, what disease will we see increase in people?
4. How has
Chernobyl affected children born years after the disaster?
5. What
does the physicist, Michio Kaku, advise that every nation in the world do to
prevent this from happening again?
VIDEO PRACTISE (3ºC)
Listen carefully and answer the questions:
|


The
Chernobyl Nuclear Explosion
1. Why
did the Soviet Union rely on nuclear power?
2.
What was
Chernobyl?
3.
What type of
tests were the employees doing when the nuclear explosion occurred?
4.
How many
firefighters died in the fire? What was the cause of their deaths?
5.
How did the
Soviet government react to the explosion?
UNIT 8 (10): THE TRANSFORMATION OF THE TERTIARY SECTOR

You must also include the political map of Africa:
Deadline: wednesday 29th of may 2013
 |
| Fill in with the name of the states in capital letters and also include each of the capitals by using lower-case letters. Once it has been done stick in your notebook. Remember to bring in to class on wednesday 29th may. Use the students book for getting the information about it. |
UNIT 2 (11): SPAIN
Printable notes
THE PHYSICAL MAP OF SPAIN
The
geographical uniqueness of the Iberian Peninsula has been recognized since
ancient times.
The
landmass of the Iberian Peninsula is located in the temperate zone of the
Northern Hemisphere, creating a crossroads between Europe and Africa and between the Atlantic Ocean and the
Mediterranean Sea. This position has a decisive influence on the climatic
conditions and gives rise to the presence of four distinct natural
environments: Oceanic, Mediterranean, Subtropical (Canary Islands) and
Mountainous. The way the land relief is shaped is original, due to its massif
form, its high average altitude and the location of the main mountain systems
on the periphery. This relief produces, for example, conditions which are not
very favourable for agriculture, and influences population distribution, the transport
infrastructure or the use of rivers as navigable waterways.
1. LAND
RELIEF FORMS ON THE PENINSULA
Spain is
the second European country with the highest average altitude, 660 metres, after Switzerland. It is because much of its territory is
occupied by a high central plateau (the Meseta), around which
lie other forms of land relief.
• The Meseta Central has an
altitude of 600 to 700 metres. Two ancient, low mountain ranges run across
it: the Central Sierra, which divides
the Meseta into two, the northern sub-plateau and the southern
sub-plateau; and the Toledo Mountains, dividing the southern sub-plateau
into two.
• The mountains that surround the Meseta are
the Galician Massif, the Cantabrian Mountains, the Iberian
Mountains and the Sierra Morena.
• The land relief away from the Meseta includes
various young mountain ranges: the Basque Mountains, the
Pyrenees, the Catalan coastal
range and the Baetic Mountains; and two depressions: the Ebro and the Guadalquivir.
The
Peninsula has straight coastlines which are determined by the land
relief of the interior.
• The Cantabrian coasts are relatively
straight and consist mainly of cliffs, with some beaches and estuaries. Galicia
has the most jagged coastline in Spain.
The Atlantic coast of Andalusia is
low and sandy. It is charactherised by
its marshes and other sand formations such as bars and dunes, or mounds
of sand created by the wind.
• The Mediterranean coasts are lined with
cliffs where the mountain ranges reach the coast, such as the Baetic
Mountains and the Catalan coastal range. The rest are low, sandy coasts, with
beaches, river deltas such as the one in the Ebro, and lagoons, such as that of
Valencia.
3. THE
LAND RELIEF OF THE ARCHIPELAGOS
The Balearic
Islands are a platform along the horizontal axis of the Mediterranean and
part of the vertical axis that goes from the South of France to North Africa.
They are located SW (Ibiza)
to NE (Menorca), resting on
a submarine platform which is an extension of the Baetic mountains of Cape
Nao, and are separated from the Levantine coast by a channel which is more
than a thousand metres deep.
• Most
of the coasts are cliffs, because the mountains in the islands reach the sea.
We can find, however, many wide beaches and coves in Majorca and the rest of
the islands.
4. THE
RIVERS AND THEIR WATERSHEDS
The rivers
of the Peninsula are grouped into three watersheds, depending on the
sea, or ocean they flow into.
• The rivers of the Cantabrian watershed are
short with a regular flow, they flow across steeps terrain, descending
rapidly* down the mountains near the Cantabrian Sea. The main ones include the Nalón, the
Nervión and the Bidasoa.
• The rivers of the Atlantic watershed are
long and course over wide plains before
flowing into the Atlantic Ocean. In general, they carry a lot of water
but are irregular (depending on the season and precipitation). The most important include the Miño, the
Duero, the Tagus, the Guadiana and the Guadalquivir.
• The rivers of the Mediterranean watershed, except
the Ebro, are short. They descend steep
terrain in the mountains near the Mediterranean Sea. In general, they do not
carry much water and they are very irregular.
The main ones include the Llobregat, the Ebro, the Mijares, the
Turia, the Júcar and the Segura.
We find short streams and torrents, in
the Balearic and Canary Islands, which only carry water after
heavy rainfall.
5. SPANISH LANDSCAPES
The
landscape and vegetation types vary in different parts of Spain due to the
following factors:
-Climate
-Altitude
-Distance
from the sea
The are
four main regions:
•
Mediterranean Coast
•
Central Plateau
•
Atlantic
•
Canary Islands
A. MEDITERRANEAN COAST
This area
has a Mediterranean Coast region covers the south and east coast of peninsular
Spain and the Balearic Island.
This area
has a Mediterranean climate. It is hot in summer and mild in winter.
The sea moderates the temperatures. There is not very much rain. Th
natural vegetation types are:
v
Evergereen forest (holm oak, cork oak, pine)
v
Aromatic shrubs (rosemary and lavender)
Human influence:
•
Replacing
natural vegetation with farmland : traditionally with vines and olives and
recently with fruit trees and vegetables grown in greenhouses.
•
The
impact of the tourism on the coast
B. CENTRAL PLATEAU
•
The
Central Plateau is in the centre of peninsular Spain. In many areas the
landscape is very flat, but several mountain ranges, including the Central
Sierra, cross the Central Plateau.
• This area has a Mediterranean
climate. This climate is more extreme than on the Mediterranean
coast because it is further from the sea. It is hotter in summer and colder
in winter. There is hardly any rain. The natural vegetation is everygreen
forest.
HUMAN FACTORS:
•
Cutting
down forests: for crops
•
The
growth of big cities: Madrid
• Road
and railways
C. ATLANTIC/OCEANIC
The
Atlantic region goes along the north coast of Spain from Galicia to the
Pyrenees, including the Cantabrian sea area. Elsewhere the landscape is hilly.
This
area has a maritime climate. This
means it is mild with quite high rainfall all year round, but also due to the
influence of the sea. There is a lot of vegetation because of the rain, and the
landscape is very green. The natural vegetation types are:
v Deciuous
forests: oak, beech, chesnut
v Heathland:
heather, fern
v
Reforestation
with eucalyptus and pine trees
v
Industry
has a large impact on the environment
D. HIGH MOUNTAINS
The high
mountains have the same type of vegetation in all of the regions. As you go
higher the vegetation changes from evergreen forests to heathland to alpine
meadows to bare rock (no vegetation)
It is found
in the Peninsula above an altitude of 1000 metres. Precipitation is high,
normally around 1000 mm a year and temperatures are cold, with low winters
around 0ºC.
E. CANARY ISLANDS
The Canary
Islands were formed by volcanic eruptions. The western islands are mountainous
and the eastern islands are flat.
The islands
have a subtropical climate because they are near the Tropic of Cancer. There is
not much change in temperature by seasons and there is not much rain.
The natural
vegetation types are:
• Humid
subtropical laurel forests
•
Plam trees, dragon trees and Canary Island palms
Human influence:
• Agricultural:
terraces on slopes
•
Building
hotels and apartments for tourism
6. THE ORGANISATION OF SPAIN
The
Spanish state is governed by a set of laws and regulations which are
contained in the Constitution of 1978.
A. THE POLITICAL ORGANISATION
The
Spanish satate is social, democratic and the rule of law applies,
because the power of the state and the government is limited by the
constitution and laws.
Sovereignity lies with
the Spanish people, and all powers emanate from them. The people delegate
this power to representatves elected in general elections
The
political system is a parliamentary monarchy. The king is the head of the
state but he has limited functions.
The
powers of the state are divided between different institutions:
vThe Cortes Generales (Parliament) have the legislative power. Composed of two chambers
elected every four years:
• Congreso de
los Diputados: represents the Spanish people
• Senado:
territorial representation
vThe Governmet holds the executive power. Composed od the president and ministers.
vThe courts of justice exercise the judicial power.
B. THE AUTONOMOUS COMMUNITIES
After being
recognised by the 1978 Constitution, 17 autonomous communities and two
autonomous cities, Ceuta and Melilla, were created
Each
community is governed by a statute of autonomy or fundamental law. They also
have their own institutions: the Regional Parliament, the Government and
the High Court.
c. PROVINCES AND MUNICIPALITIES
The municipalities
are the smallest territorial units of the Sate. Their body of government is the
Town or City Council. Their functions are to provide services to the
inhabitants of the municipal district: waste collection, street paving, etc
Come on, let's go! :)
ResponderEliminarI'm Maria. What do we have to do in the political map of the world ?
EliminarSorry for the typing mistakes that I had to correct by hand cause of my computer....."S" third person of singular
ResponderEliminarI am not comming this monday 10 december. The teacher in charge of the guard duty is carrying our lesson plan for the new unit with the activities I have underlined. Please show also the physical map of SouthAmerica to Candela in 3D and to Maria in 3C, they have the smiling start stamp.
ResponderEliminarThanks
Here you have the new blog for Global Calssrooms:
ResponderEliminarhttp://gciesparquedelisboa.blogspot.com.es/
Here you have the map done. You need to colour the those countries that appear in the book according to a scale (you can invent it, I just suggest 4 colours) for the GDP.
ResponderEliminar